
In Brief
Population change is explained through births, deaths, migration and the age structure of communities. It cannot establish a collective political intention. India's fertility has fallen substantially, including among Hindus and Muslims, while differences between groups have narrowed. Census counts, survey estimates and projections are different kinds of evidence and must be dated. A projection is conditional, not a prediction that must come true. Understanding these distinctions makes it possible to discuss public services, reproductive health and demographic change without treating children or families as threats.
Detailed Story
Start with the measure
Total fertility rate, or TFR, is an estimate of how many children a woman would have if the age-specific fertility rates measured for a period applied throughout her reproductive life. It is not a count of the children already born to every woman, and it is not the annual population growth rate.
Population size also depends on deaths, migration and age structure. A youthful population can continue growing after fertility falls because many people are entering childbearing ages. This demographic momentum helps explain why a falling fertility rate does not produce an immediate fall in population.
What the Indian evidence shows
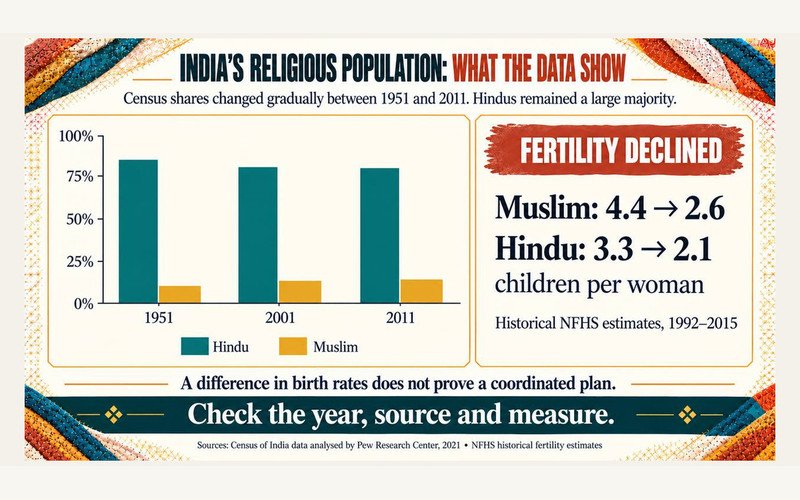
Pew's analysis of India's censuses and family health surveys reports a substantial decline in fertility across religious groups. Between 1992 and 2015, the Muslim estimate fell from about 4.4 to 2.6 children per woman and the Hindu estimate from about 3.3 to 2.1. [1] The gallery's comparison describes this historical period; it should not be presented as a current measurement.
NFHS-5, conducted in 2019–2021, estimated TFR at 2.36 among Muslims and 1.94 among Hindus. [2] These are group averages, with considerable variation by education, economic circumstances and place. They are not descriptions of every household. Comparing one community's recent figure with another community's much older figure would manufacture a misleading contrast.
The exhibition combines historical census shares with dated fertility estimates. Those measures answer different questions and should retain separate labels. A fertility estimate cannot be read as the current share of the population, and neither measure reveals the intentions of every family.
Counts and projections answer different questions
The 2011 Census recorded Hindus as approximately 79.8% and Muslims as approximately 14.2% of India's population. [1] Those figures are a census snapshot, not a live population counter. A change in a group's percentage also differs from a change in its absolute number: several communities can increase numerically while their shares change in different directions.
The revised panel uses observed historical data rather than presenting a distant projection as a current fact. A projection carries forward assumptions about fertility, mortality, migration and other demographic processes. Its usefulness depends on stating those assumptions and uncertainties. Historical census and survey observations remain the anchors for this article.
Why averages do not reveal intentions
Demographic data do not ask every parent why a child was born. A community-level difference cannot demonstrate a coordinated plan. Such a claim would require independent evidence of organisation and intent; it cannot be inferred from a fertility table.
Access to education, reproductive healthcare, contraception, secure livelihoods and child survival all matter to the conditions in which families make decisions. Their relationships are complex, and a single religious label cannot stand in for all of them. Public discussion becomes more useful when it asks whether people can make informed, voluntary choices and whether services meet actual needs.
Replace competition with planning
Schools, transport, housing and healthcare need reliable population estimates. Planning also requires attention to regional ageing and differences within communities, rather than only national religious totals. A family is not a demographic weapon, and a child's entitlement to education does not depend on whether their community's share is rising or falling. Evidence can guide resource allocation while preserving that equal civic standing.
Facts & Figures
2011 Census religious shares: Hindu 79.8%; Muslim 14.2%, rounded. [1]
NFHS-5, 2019–2021: Hindu TFR 1.94; Muslim TFR 2.36. [2]
1992–2015 fertility comparison: Hindu 3.3 to 2.1; Muslim 4.4 to 2.6 children per woman, rounded estimates reported by Pew. [1]
Important Distinction
A census counts a population at a reference time; a survey estimates characteristics from a sample; a projection models possible future outcomes. None, by itself, establishes political intent.
Sources & Further Reading
1. Pew Research Center. Religious composition of India and Causes of religious change, 21 September 2021. https://www.pewresearch.org/religion/2021/09/21/religious-composition-of-india/ ; https://www.pewresearch.org/religion/2021/09/21/causes-of-religious-change/
2. International Institute for Population Sciences and ICF. National Family Health Survey (NFHS-5), 2019–21: India, Volume I, 2022, fertility tables. https://dhsprogram.com/pubs/pdf/FR375/FR375.pdf
3. Pew Research Center. Methodology: Religious composition of India, 2021. https://www.pewresearch.org/religion/2021/09/21/methodology-41-4/
Related Topics
How fear becomes collective blame